1.3 Grade Levels in a Year: What Our 2025–26 Data Says About Math Gaps in K–5
A math gap behaves like a debt. Nobody invoices a kindergartner for the skills they didn't master; the charge rolls forward quietly, accruing interest, until somewhere around fourth grade the interest is most of what they owe. On the 2024 NAEP, 39 percent of American fourth graders performed at or above proficient in mathematics. Most of the other 61 percent fell behind years earlier; fourth grade is just where the ledger gets audited.
We know this with unusual confidence, because it is one of the better-replicated findings in education research. Greg Duncan's analysis of six longitudinal studies found early math skills to be the strongest predictor of later school achievement, ahead of early reading and attention. And a 2014 follow-up by Watts, Duncan, Siegler, and Davis-Kean found something stranger and more useful: how much a child's math ability grows between preschool and first grade predicts their achievement at age 15 more strongly than where they started. Growth beats starting point. A school cannot choose its incoming kindergartners. But it can choose what happens to them next.
But isn't choosing what happens next exactly what teachers already do? Yes — heroically, and against arithmetic that refuses to cooperate. A typical class of twenty-five spans five levels of readiness, sometimes more, and one adult cannot deliver instruction at five levels at once; in a rotation model, most students spend most of math time working without the teacher. Nobody can hand-build twenty-five individual pathways every day. That is the job we built Happy Numbers to do, and 2025–26 was the year we could measure, at scale, what happens when it does the job at recommended usage: 35 minutes a week in kindergarten, 45 minutes in grades 1–5.
K–2: the year the ledger stays clean
Students who worked at recommended usage grew 1.3+ grade-level years in a single school year — in every grade, K through 5, against lower-usage peers on the same platform (internal analysis of 2025–26 usage). In K–2 the movement is easiest to see. The share of students at or above grade level rose from 41% at the start of the year to 64% by the end. Of the students who began the year below grade level, 46% reached grade-level expectations by spring. And the group that usually hardens into a Tier 3 caseload — students more than a year behind — nearly vanished from the distribution.
For an administrator, the translation is plain: fewer students enter grade 3 carrying debt, which means fewer intervention seats, fewer referrals, and a smaller version of the problem NAEP eventually audits.
Grades 3–5: paying down the compounded debt
Now the harder case. Only 33% of our 3–5 students began the year at grade level, against 41% in K–2 — the deficit is itself the record of earlier years, compounding on schedule.
Within one year at recommended usage, students at or above grade level rose from 33% to 46%. The share more than two grade levels behind was halved, from 8% to 4%. Among students who started more than a year behind, 57% climbed at least one tier, and 5% reached grade-level expectations outright. What the data will not promise is a one-year miracle for the furthest behind: students carrying the largest gaps typically need a second year to finish the climb, which is why we tell schools to budget Happy Numbers in upper elementary as a two-year instrument. The debt analogy holds to the end — the interest is cheaper to pay this year than next, and it was cheapest of all in kindergarten.
How the growth actually happens
The mechanism is unglamorous, which is a point in its favor. A 10–20-minute adaptive placement test builds each student an individual pathway at exactly their level. From there the student works in what Vygotsky called the zone of proximal development — in classroom shorthand, the zone: work just past what they can do alone, with scoring that blocks clicking through without learning. Take addition. Most programs illustrate 8 + 3 with a static picture: eight cubes and three cubes sitting side by side, answer expected below. Happy Numbers hands the child the cubes — they drag the three over to the eight, on screen, and count what the pile has become. A misconception, if one is forming, surfaces at that exact step, and the child builds conceptual understanding with their hands before any drilling to automaticity begins. In the PK-1 every task is read aloud automatically — Spanish included; from grade 2 the voiceover is there on demand. The same logic runs through every support: each one withdraws step by step as students stop needing them. The teacher's cost is the placement test. After that, students work independently while the teacher runs small groups, and class- and student-level reports show where each child is stuck before a small gap starts compounding.
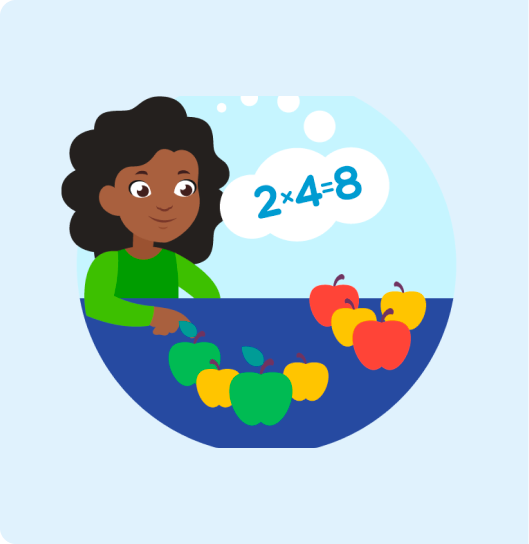
Happy Numbers develops students' deep conceptual understanding of math by presenting them with multiple representations of each skill.
Schools that ran this experiment before we wrote it up
The 2025–26 numbers agree with what individual schools have documented on their own. In Union School District in California, students grew 1.4 grade-level years and proficiency rose from 67% to 90%. At Townville Elementary in South Carolina's Anderson School District 4, instructional coach Stephanie Dixon watched students meeting or exceeding grade-level expectations climb from 43% at baseline to 95% by year's end.
About 2 million students have used Happy Numbers, and most arrived the same way: a teacher found the free adaptive PK–5 math program on their own and brought it into the classroom. The odds are decent that someone in your building already has. If so, a school-wide license adds the layer above the classroom: unlimited practice time, school-level reporting, Clever and ClassLink rostering, and implementation support that turns one classroom's results into a building's. One email gets you a quote: team@happynumbers.com.
Growth figures: internal analysis of 2025–26 usage, students at recommended weekly usage (35 min/wk K; 45 min/wk grades 1–5). Cohorts: K–2 n = 9,775; 3–5 n = 6,465; 3–5 below-grade cohort (Tiers 3–4) n = 1,668.



 Previous Article